

The Markets (as of market close January 31, 2019)
Investors celebrated a month in which several indexes posted their best January performance in three decades. A strong labor market, low inflation, and a more "patient" Federal Reserve Board all sent encouraging messages to investors who were hungry for good news after last December's precipitous plunge. The Russell 2000 led the charge, closing the month more than 11% higher than its 2018 close, followed by a nearly 10% gain in the Nasdaq, while the S&P 500, Dow, and Global Dow all topped 7%.
By the close of trading on January 31, the price of crude oil (WTI) was $53.95 per barrel, up from the December 31 price of $45.81 per barrel. The national average retail regular gasoline price was $2.256 per gallon on January 28, down slightly from the December 31 selling price of $2.266 and $0.351 lower than a year ago. The price of gold rose by the end of January, reaching $1,325.70 by close of business on the 31st, up from $1,284.70 at the end of December.
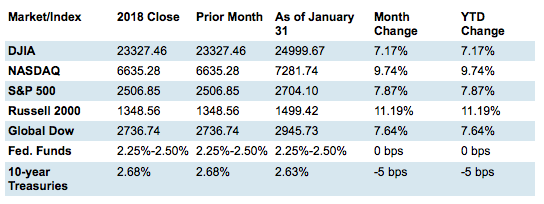
Chart reflects price changes, not total return. Because it does not include dividends or splits, it should not be used to benchmark performance of specific investments.
Last Month's Economic News
Note: Due to the partial government shutdown earlier this month, some reports were delayed.
- Employment: Total employment rose by 312,000 in December after adding 176,000 (revised) new jobs in November. Notable employment increases for the month occurred in health care (50,000), food services and drinking places (41,000), construction (38,000), manufacturing (32,000), and transportation and warehousing (25,000). The unemployment rate advanced from 3.7% in November to 3.9% in December. The number of unemployed persons increased by 276,000 to 6.3 million. A year earlier, the jobless rate was 4.1%, and the number of unemployed persons was 6.6 million. The labor participation rate rose 0.2% from November to 63.1% in December. The employment-population ratio remained at 60.6%. The average workweek increased 0.1 hour to 34.5 hours in December. Average hourly earnings increased by $0.11 to $27.48. Over the last 12 months, average hourly earnings have risen $0.84, or 3.2%.
- FOMC/interest rates: At its two-day meeting on January 29 and 30, the Federal Open Market Committee decided to leave rates unchanged, and, in an apparent reversal from opinions expressed last month, did not predict whether future hikes were in the future. "In light of global economic and financial developments and muted inflation pressures, the Committee will be patient as it determines what future adjustments to the target range for the federal funds rate may be appropriate to support these outcomes." The next FOMC meeting is scheduled for March 19 and 20.
- GDP/budget: The advance estimate of the fourth-quarter gross domestic product, scheduled for release earlier this week, was delayed.
- Inflation/consumer spending: The Consumer Price Index fell 0.1% in December after being unchanged in November. Over the previous 12 months, the CPI rose 1.9%. Core prices, which exclude food and energy, climbed 0.2% for the month and were up 2.2% over the previous 12 months. According to the Producer Price Index, the prices companies received for goods and services dropped 0.2% in December following a 0.1% increase in November. Producer prices increased 2.5% over the 12 months ended in December. Prices less food, energy, and trade services were unchanged in December after rising 0.3% the prior month, and were up 2.8% over the previous 12 months. The Personal Income and Outlays report, scheduled for release earlier this week, was delayed.
- Housing: The housing sector has been slow to pick up speed primarily due to higher mortgage rates and scant inventory. Sales of existing homes plunged 6.4% in December from November. Year-over-year, existing home sales were down 10.3%. The December median price for existing homes was $253,600, down from $257,700 in November. However, existing home prices were up 2.9% from December 2017. Total housing inventory for existing homes for sale fell from 1.74 million in November to 1.55 million in December, rendering a 3.7-month supply at the then-current sales pace. By contrast, sales of new single-family homes jumped by 17% from October to November 2018, but were nearly 7.7% lower than in November 2017. The median sales price for new homes was $302,400, down from $325,100 in October and $41,000 lower than a year prior.
- Manufacturing:The manufacturing sector gained momentum in December. Industrial production edged up 0.3% following a 0.4% advance in November. For the fourth quarter, industrial production advanced at an annual rate of 3.8%. Manufacturing output increased 1.1% — its largest gain since February 2018. The index for mining increased 1.5%, but utilities dropped 6.3%, as warmer-than-usual temperatures lowered the demand for heating. The advance report on durable goods, scheduled for release on January 25, was delayed.
- Imports and exports:The advance report on international trade in goods, scheduled for release earlier this week, was delayed.
- International markets:Global stocks responded well to news that the Federal Reserve was hitting the pause button on interest rate hikes, closing out a strong month. And after two days of high-level trade discussions between U.S. and Chinese officials, President Trump confirmed plans to meet with Chinese President Xi Jinping to try to finalize a deal between the two countries by March 1. He also announced that U.S. Trade Representative Robert Lighthizer and Treasury Secretary Steven Mnuchin would travel to China to further the negotiations in the interim. In the eurozone, fourth-quarter growth was tepid, with reports indicating that Italy had fallen into a recession. Global investors were also concerned about reports that China's manufacturing sector had dipped for the second month in a row, and have been monitoring what happens with Brexit as the March 2019 deadline approaches for a deal to pave the way for the United Kingdom's exit from the European Union.
- Consumer confidence:The Conference Board Consumer Confidence Index® declined in January, following a dip in December. The index now stands at 120.2, down from 126.6 in December. The Present Situation Index, which gauges how consumers feel about current business and labor market conditions, dropped by a minimal 0.3. By contrast, the Expectations Index, which measures how consumers view the short-term outlook for income, business, and labor market conditions, dropped more than 10 points. Lynn Franco, Senior Director of Economic Indicators at the organization, attributed the decline to concerns surrounding financial market volatility and the government shutdown.
Eye on the Month Ahead
With the federal government now back at full staff (for at least a few weeks), investors look forward to receiving additional data as it becomes available, offering a more comprehensive view of the nation's economy. Ears will also be carefully attuned to news of any progress in the U.S.-China trade talks.
Data sources: Economic: Based on data from U.S. Bureau of Labor Statistics (unemployment, inflation); U.S. Department of Commerce (GDP, corporate profits, retail sales, housing); S&P/Case-Shiller 20-City Composite Index (home prices); Institute for Supply Management (manufacturing/services). Performance: Based on data reported in WSJ Market Data Center (indexes); U.S. Treasury (Treasury yields); U.S. Energy Information Administration/Bloomberg.com Market Data (oil spot price, WTI Cushing, OK); www.goldprice.org (spot gold/silver); Oanda/FX Street (currency exchange rates). News items are based on reports from multiple commonly available international news sources (i.e. wire services) and are independently verified when necessary with secondary sources such as government agencies, corporate press releases, or trade organizations. All information is based on sources deemed reliable, but no warranty or guarantee is made as to its accuracy or completeness. Neither the information nor any opinion expressed herein constitutes a solicitation for the purchase or sale of any securities, and should not be relied on as financial advice. Past performance is no guarantee of future results. All investing involves risk, including the potential loss of principal, and there can be no guarantee that any investing strategy will be successful.
The Dow Jones Industrial Average (DJIA) is a price-weighted index composed of 30 widely traded blue-chip U.S. common stocks. The S&P 500 is a market-cap weighted index composed of the common stocks of 500 leading companies in leading industries of the U.S. economy. The NASDAQ Composite Index is a market-value weighted index of all common stocks listed on the NASDAQ stock exchange. The Russell 2000 is a market-cap weighted index composed of 2,000 U.S. small-cap common stocks. The Global Dow is an equally weighted index of 150 widely traded blue-chip common stocks worldwide. The U.S. Dollar Index is a geometrically weighted index of the value of the U.S. dollar relative to six foreign currencies. Market indices listed are unmanaged and are not available for direct investment.


