

The Market (as of market close February 28, 2019)
Each of the benchmark indexes listed here posted positive monthly gains, led by the Russell 2000, which lapped the field after gaining over 5.0% for the month. The small-cap index is almost 17.0% ahead of its 2018 closing value. Signs that a trade accord with China may be in the offing helped stimulate investors to trade throughout February. Also, word from the Federal Reserve that it may not raise the target interest rate range as aggressively as proposed last year has had a positive impact on stocks.
Corporate earnings season continued on a relatively positive trend, while energy stocks rebounded as oil production was curbed, sending gas prices at the pumps higher. Overall, following the Russell 2000, the Dow posted the next highest monthly gain ahead of the Nasdaq, S&P 500, and the Global Dow.
By the close of trading on February 28, the price of crude oil (WTI) was $57.26 per barrel, up from the January 31 price of $53.95 per barrel. The national average retail regular gasoline price was $2.390 per gallon on February 25, up from the January 28 selling price of $2.256 but $0.158 lower than a year ago. The price of gold dipped by the end of February, falling to $1,314.40 by close of business on the 28th, down from $1,325.70 at the end of January.
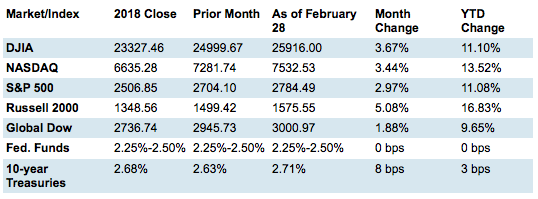
Chart reflects price changes, not total return. Because it does not include dividends or splits, it should not be used to benchmark performance of specific investments.
Last Month's Economic News
Note: Due to the partial government shutdown earlier last month, information from some reporting agencies is delayed.
- Employment: Total employment rose by 304,000 in January after adding 222,000 (revised) new jobs in December. The average monthly job gain in 2018 was 223,000. Notable employment increases for January occurred in leisure and hospitality (74,000), construction (42,000), health care (42,000), and food services and drinking places (37,000). The unemployment rate jumped from 3.9% in December to 4.0% in January. The number of unemployed persons increased to 6.5 million. The impact of the partial federal government shutdown contributed to the uptick in these measures. The labor participation rate rose 0.1% from December to 63.2% in January. The employment-population ratio also advanced 0.1% to 60.7%. The average workweek was unchanged at 34.5 hours for the first month of the year. Average hourly earnings increased by $0.03 to $27.56. Over the last 12 months, average hourly earnings have risen $0.85, or 3.2%.
- FOMC/interest rates: The Federal Open Market Committee did not meet in February, after leaving interest rates unchanged in January. The next FOMC meeting is scheduled for March 19 and 20.
-
GDP/budget: The advance estimate of the fourth-quarter gross domestic product showed the economy grew at an annualized rate of 2.6%. The GDP expanded at a rate of 3.4% in the third quarter. Of note, consumer spending rose by 2.8%, despite a sharp decline in December retail sales. Also of note, business investment rose 6.2% for nonresidential fixed investment. On the other hand, residential investment was weak, falling by 3.5%. The federal budget deficit was $13.54 billion in December. For the three months of fiscal year 2019, the government deficit is $319 billion. Over the same period for fiscal year 2018, the deficit was $225 billion.
-
Inflation/consumer spending: The report on consumer income and spending, one that is favored by the Federal Reserve as an inflation indicator, showed personal income increased 1.0% in December while it decreased 0.1% in January (the report has income and expenditures for December and only income for January). Disposable (after-tax) income increased 1.1% in December but fell 0.2% in January. Consumer spending (personal consumption expenditures) decreased 0.5% in December.
-
The Consumer Price Index was unchanged in January following no change in December. Over the previous 12 months, the CPI rose 1.6%. Core prices, which exclude food and energy, climbed 0.2% for the month and were up 2.2% over the previous 12 months.
-
According to the Producer Price Index, the prices companies received for goods and services dropped 0.1% in January following a 0.1% decrease in December. Tumbling energy and food prices helped drive producer prices lower. Over the 12 months ended in January, producer prices increased 2.5%.
-
Housing: Following a mundane 2018, the housing sector continues to lack steam entering the new year. Sales of existing homes fell 1.2% in January after plunging 6.4% in December. Year-over-year, existing home sales were down 8.5%. The January median price for existing homes was $247,500, down from $253,600 in December. Existing home prices were up a relatively scant 2.8% from January 2018. Total housing inventory for existing homes for sale in January increased to 1.59 million, up from 1.53 million existing homes available for sale in December. There was no government report on new home sales in February (for December). That report is scheduled for release on March 5.
-
Manufacturing:The manufacturing sector lost steam in January as industrial production fell 0.6% following a 0.1% advance in December. In January, manufacturing production fell 0.9%, primarily as a result of a large drop in motor vehicle assemblies; factory output excluding motor vehicles and parts decreased 0.2%. The latest figures on durable goods orders from the Census Bureau are for December (again, due to the government shutdown). New orders for manufactured durable goods increased 1.2% following a 1.0% jump in November. Transportation led much of the increase, as new orders excluding transportation increased only 0.1% in December.
-
Imports and exports: The latest information on international trade in goods and services, out February 6, is for November. For that month, the goods and services deficit was $49.3 billion, down $6.4 billion from October's figures. November's exports were $1.3 billion less than October exports. Imports were $7.7 billion less than October imports. Year-to-date, the goods and services deficit increased $51.9 billion, or 10.4%, from the same period in 2017. The advance international trade in goods report for December showed the trade deficit sat at $79.5 billion, up $9.0 billion from $70.5 billion in November. Exports of goods for December were $135.7 billion, $4.0 billion less than November exports. Imports of goods for December were $215.2 billion, $5.0 billion more than November imports.
-
International markets: In Great Britain, Prime Minister Theresa May was unable to gain parliamentary approval of the exit deal she negotiated with the European Union. In addition, there does not appear to be a package that the British government can agree on, leading to the likelihood that the March 29 scheduled UK exit from the European Union will be delayed. On a larger scale, world trade regressed in 2018 as the trade war between the United States and China pulled the reins on global economic growth. According to the CPB Netherlands Bureau for Economic Policy Analysis, total goods trade across borders slowed from a 4.7% increase in 2017 to a 3.3% gain in 2018.
-
Consumer confidence:The Conference Board Consumer Confidence Index® increased in February following a decline in January. The index now stands at 131.4, up from 121.7 in January. The Present Situation Index, which gauges how consumers feel about current business and labor market conditions, improved in February, as did consumers' outlook for income, business, and labor market conditions over the short term.
Eye on the Month Ahead
Gains in the market last month were due, in large part, to apparent progress made in trade negotiations between the United States and China. Whether an accord is actually reached in March remains to be seen. Economic data has been a mixed bag through the first few months of the new year. Inflation has been subdued; manufacturing — and more importantly, business investment in capital goods production — has also been marginal. As the first quarter comes to an end, look for more current information on the state of the economy as the government reporting agencies catch up with data.
Data sources: Economic: Based on data from U.S. Bureau of Labor Statistics (unemployment, inflation); U.S. Department of Commerce (GDP, corporate profits, retail sales, housing); S&P/Case-Shiller 20-City Composite Index (home prices); Institute for Supply Management (manufacturing/services). Performance: Based on data reported in WSJ Market Data Center (indexes); U.S. Treasury (Treasury yields); U.S. Energy Information Administration/Bloomberg.com Market Data (oil spot price, WTI Cushing, OK); www.goldprice.org (spot gold/silver); Oanda/FX Street (currency exchange rates). News items are based on reports from multiple commonly available international news sources (i.e. wire services) and are independently verified when necessary with secondary sources such as government agencies, corporate press releases, or trade organizations. All information is based on sources deemed reliable, but no warranty or guarantee is made as to its accuracy or completeness. Neither the information nor any opinion expressed herein constitutes a solicitation for the purchase or sale of any securities, and should not be relied on as financial advice. Past performance is no guarantee of future results. All investing involves risk, including the potential loss of principal, and there can be no guarantee that any investing strategy will be successful.
The Dow Jones Industrial Average (DJIA) is a price-weighted index composed of 30 widely traded blue-chip U.S. common stocks. The S&P 500 is a market-cap weighted index composed of the common stocks of 500 leading companies in leading industries of the U.S. economy. The NASDAQ Composite Index is a market-value weighted index of all common stocks listed on the NASDAQ stock exchange. The Russell 2000 is a market-cap weighted index composed of 2,000 U.S. small-cap common stocks. The Global Dow is an equally weighted index of 150 widely traded blue-chip common stocks worldwide. The U.S. Dollar Index is a geometrically weighted index of the value of the U.S. dollar relative to six foreign currencies. Market indices listed are unmanaged and are not available for direct investment.
IMPORTANT DISCLOSURES
Broadridge Investor Communication Solutions, Inc. does not provide investment, tax, legal, or retirement advice or recommendations. The information presented here is not specific to any individual's personal circumstances.
To the extent that this material concerns tax matters, it is not intended or written to be used, and cannot be used, by a taxpayer for the purpose of avoiding penalties that may be imposed by law. Each taxpayer should seek independent advice from a tax professional based on his or her individual circumstances.
These materials are provided for general information and educational purposes based upon publicly available information from sources believed to be reliable — we cannot assure the accuracy or completeness of these materials. The information in these materials may change at any time and without notice.
This communication is strictly intended for individuals residing in the state(s) of IN. No offers may be made or accepted from any resident outside the specific states referenced.
Prepared by Broadridge Investor Communication Solutions, Inc. Copyright 2019.


